 1 of 12 – Visual Analytics
-
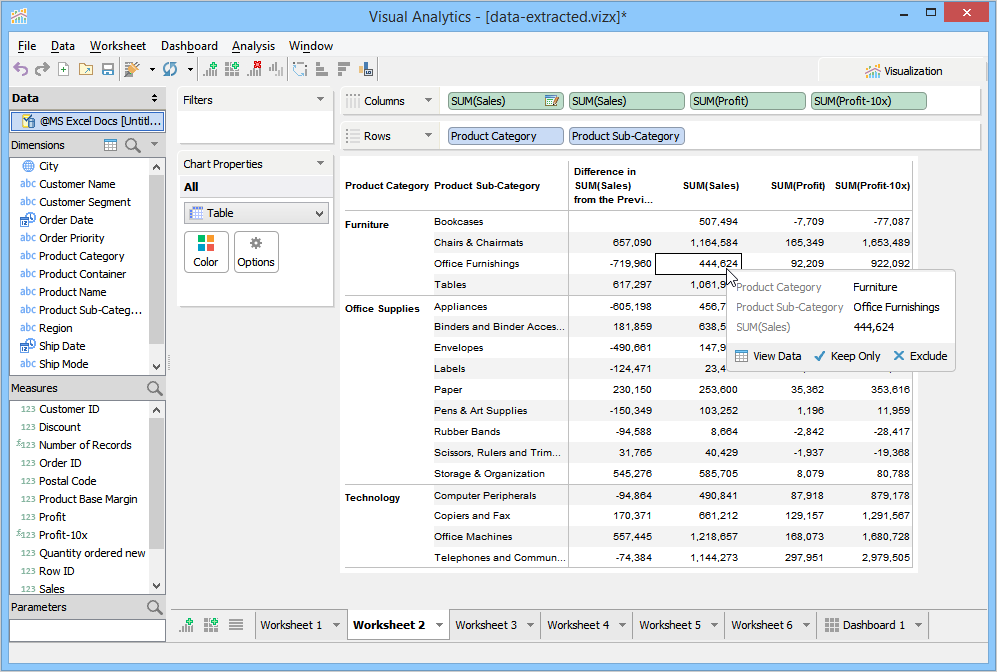
2 of 12 – Visual Analytics – Pivot Table
-
3 of 12 – Visual Analytics – Trend Lines
-
4 of 12 – Visual Analytics – Calculated Fields
-
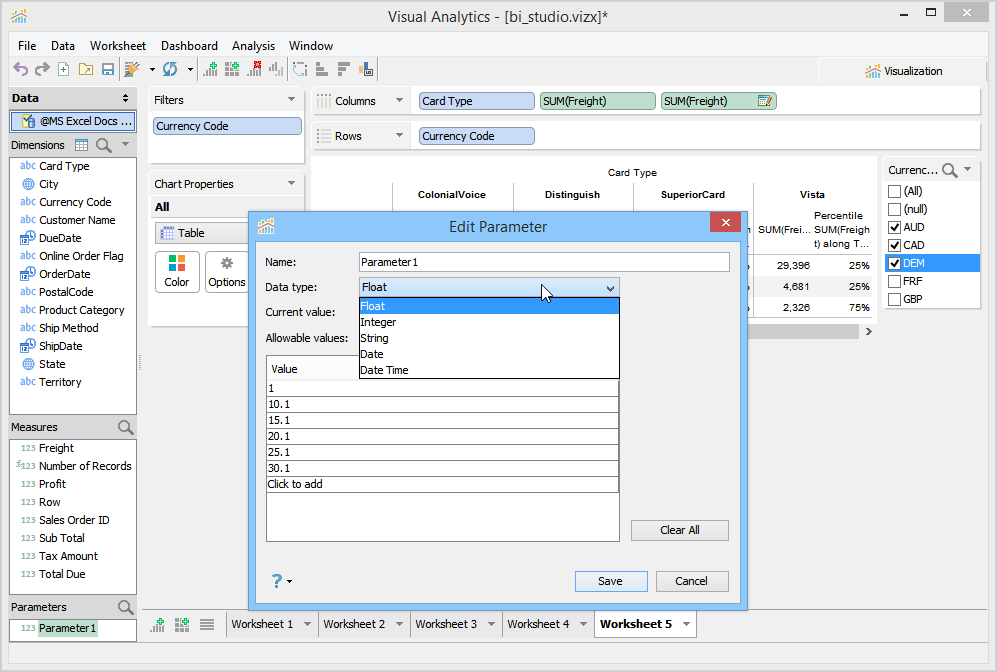
5 of 12 – Visual Analytics – Parameters
-
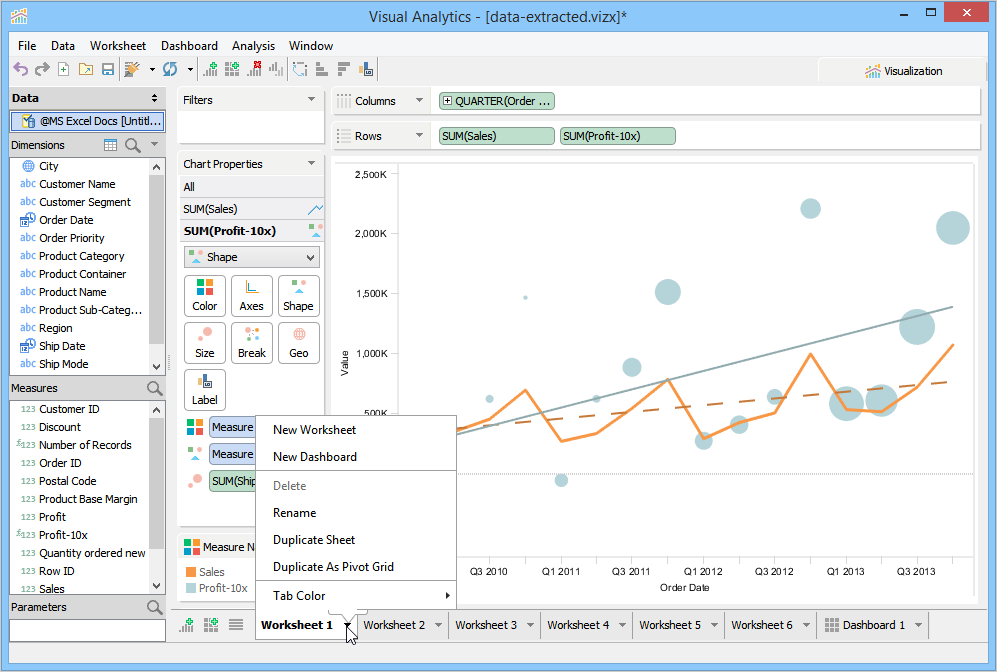
6 of 12 – Visual Analytics – Worksheets
-
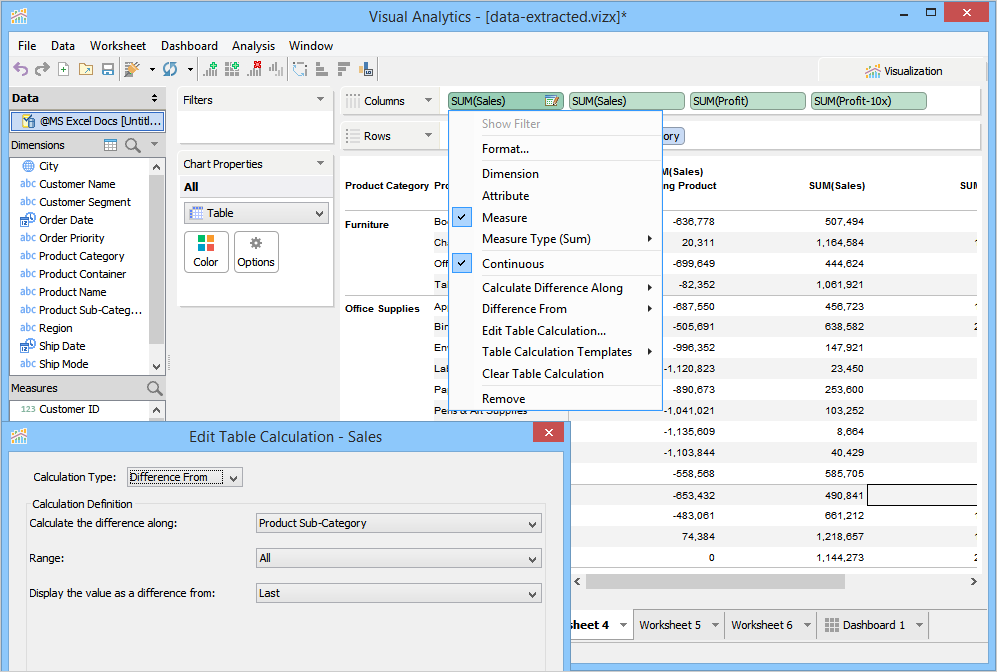
7 of 12 – Visual Analytics – Table Calculations
-
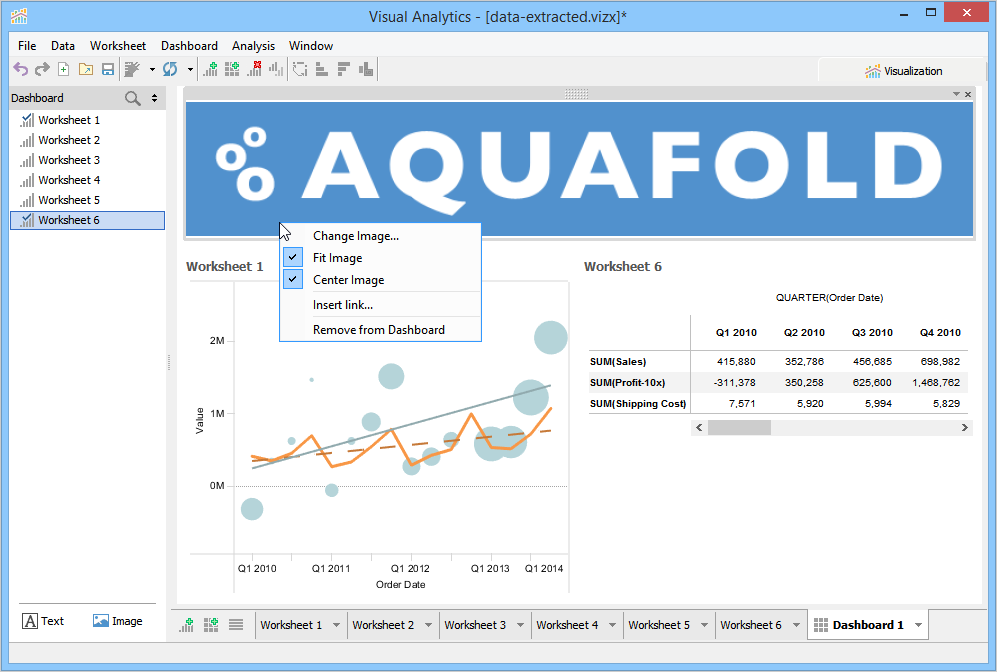
8 of 12 – Visual Analytics – Dashboards
-
9 of 12 – Visual Analytics – Combination Charts
-
10 of 12 – Visual Analytics – Packaged Workbooks
-
11 of 12 – Visual Analytics – R Integration
-
12 of 12 – Visual Analytics – Reference Lines and Box plots
Visual Analytics
Visual Analytics1 allows you to pull query results into worksheets to create engaging visualizations of your data. You can create dashboards by dragging in visualizations from many worksheets and you can save and share them in workbooks with colleagues and customers allowing them to easily navigate and interact with your data.
Visual Analytics features include:
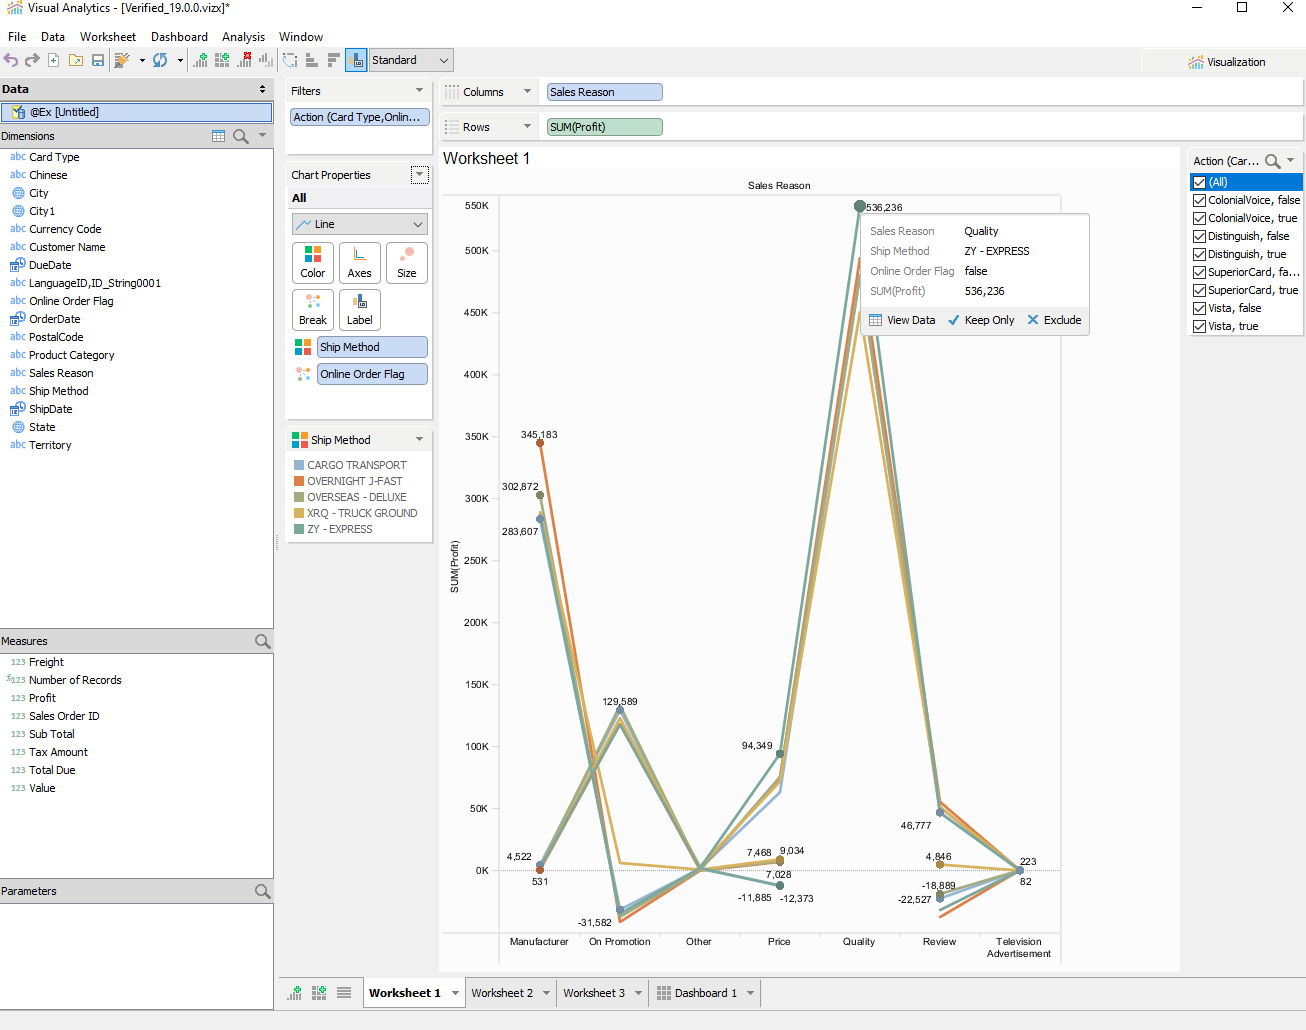
Datasets, Pivot Tables and Charts
Aggregate multiple datasets and build pivot tables and chart visualizations of your data in worksheets. Execute queries on your database servers and pull them into your workbooks, then easily drag and drop to create custom visualizations with filters, calculations and interactive controls.
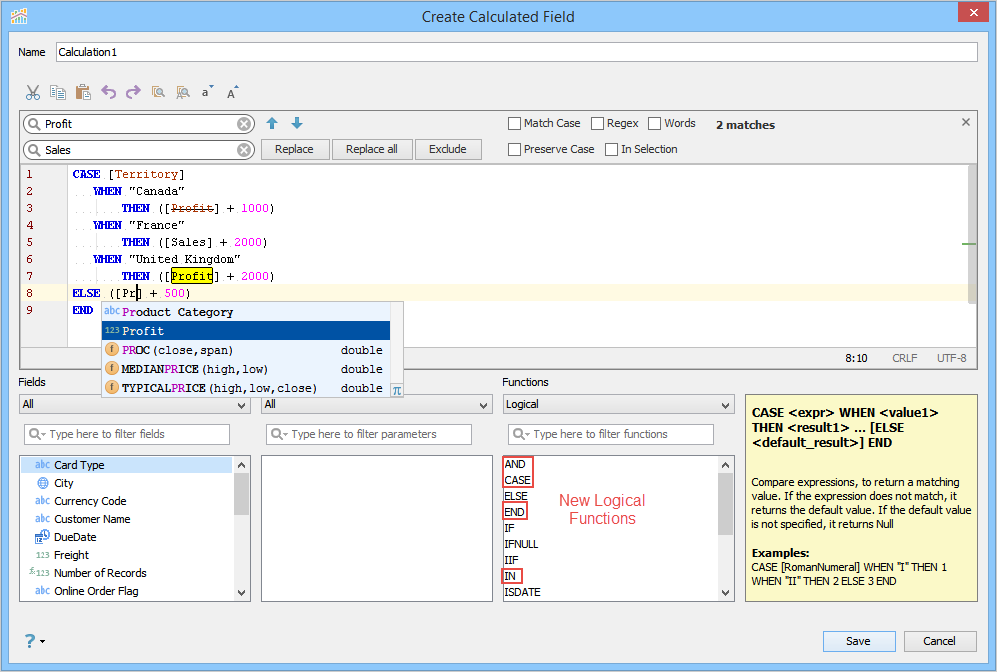
Calculated Fields and Parameters
Augment your datasets with calculated fields and parameters. Users may add calculated fields which are new fields in your dataset where the values are based on user defined expressions of formulas, column values and constants. Parameters allow for controls to the calculated values that allow for users to quickly change content displayed in worksheets and workbooks. Parameters with the same names and types from different sources can be linked, allowing the value of the parameter and all linked parameters to be changed.
Table Calculations
Table calculations allow you to add data to your worksheet with formulas that work on the data of your visualization. Create calculations of moving averages, running totals, percent of total and other custom calculations to better analyze your data and make more accurate decisions. Sort table calculations vertically or horizontally for cells showing a percentage, a rank, or a percentile. Other table calculations can be sorted in a perpendicular direction. View the table calculation formula using the calculated field dialog, and convert existing table calculations into calculated fields.
Auto Refresh
An icon showing the refresh process appears under the Data Pane. Also, while loading, the current query can be canceled just by right-clicking on it.
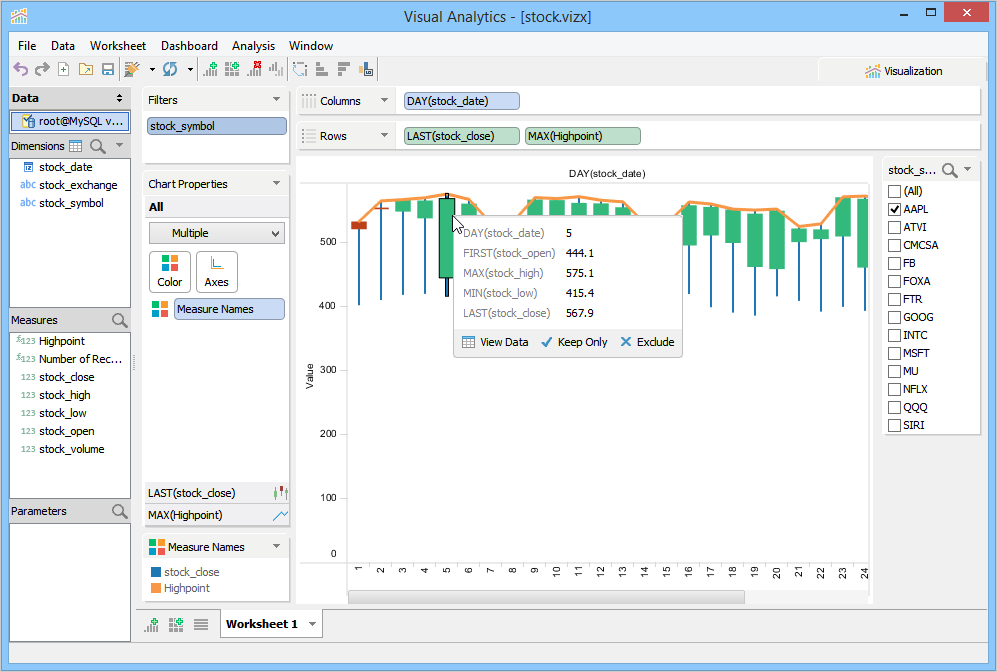
Combination Charts
Users can create combination charts within one worksheet representation of a dataset. By pivoting on multiple measure fields, you may choose to display different chart types for each series of data, whether it be as individual or merged charts to provide a combination within one graph.
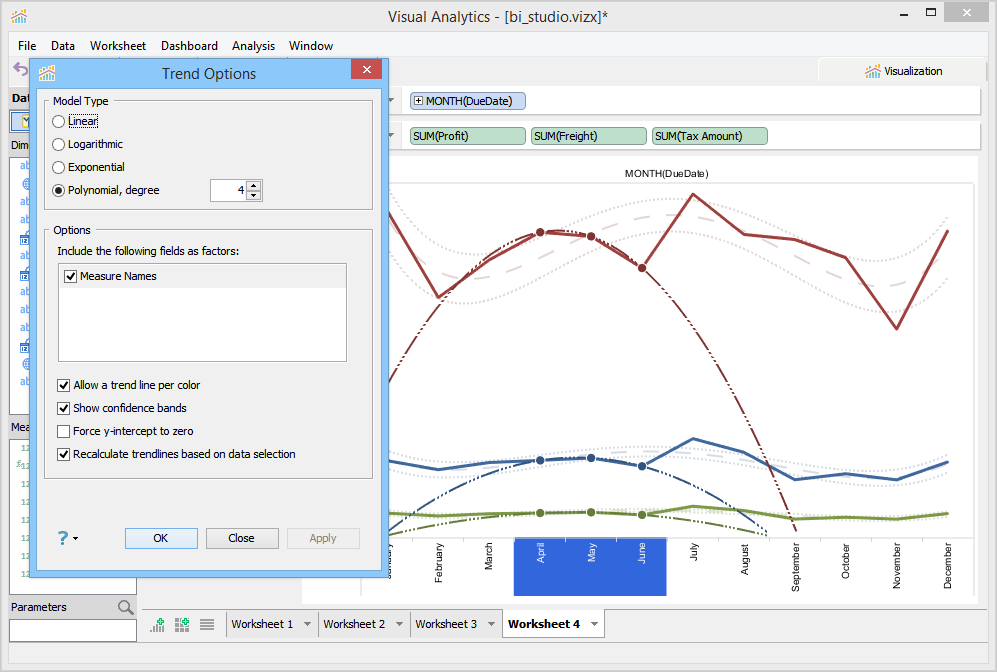
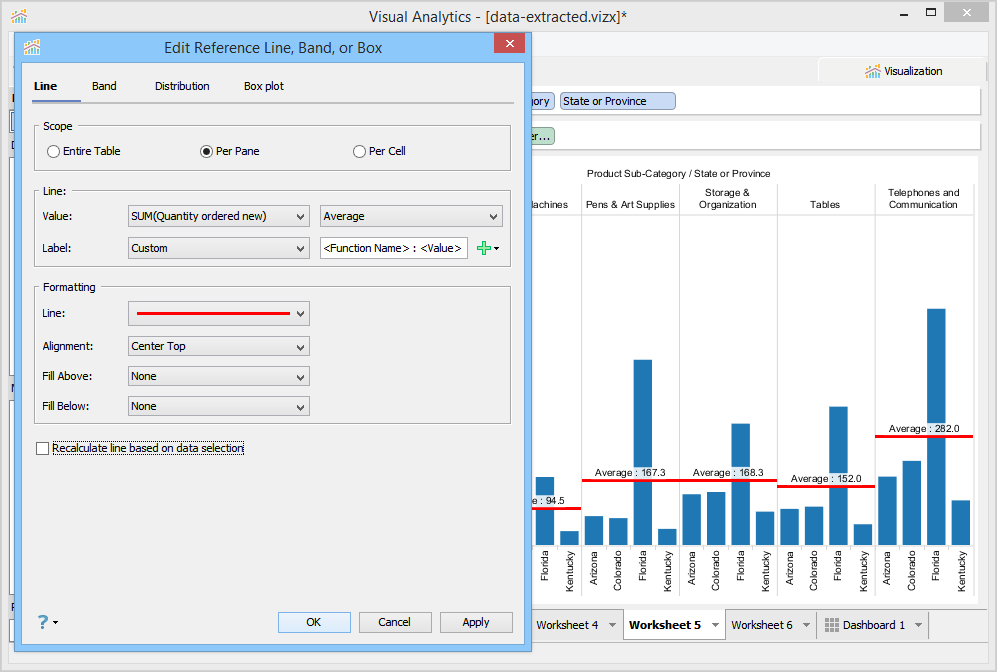
Trend Lines, Reference Lines and Box Plots
Random looking plots resulting from granular data can be better interpreted by using trend lines, reference lines and box plots. Trend lines fit a line that best represents the pattern contained within detailed data plots. Reference lines, bands, distributions and box plots offer a quick and convenient way to compare multiple data sets against a central theme and to assess the impact of groups of data points within a single set.
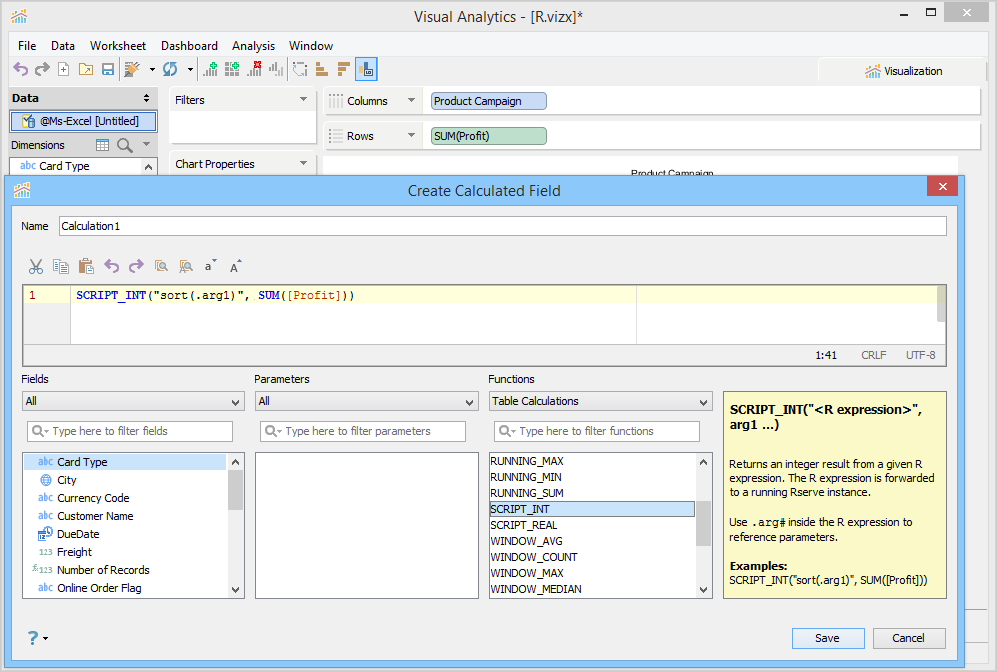
R Integration
R2 integration provides the ability to use Visual Analytics as your front end tool to rapidly create complex and meaningful visualizations of your statistical data analysis that is run using R. You create calculated fields in Visual Analytics to invoke R commands and the resulting data is plotted similar to any other field.
Worksheets
Worksheets are individual pages in a Workbook used to design pivot tables or visualizations of your datasets. An easy to use drag and drop interface allows you to quickly pivot and aggregate your datasets and visualize your aggregations in different visual representations. Easily resize cells by hovering over any edge of a column header and expand or shrink as desired.
Dashboards
Dashboards provide a workspace for placing individual worksheets within a single view with a custom layout and enables the resulting view to become interactive with custom filters and visualizations. Use dashboards as a summary view of all your worksheets which allows you to quickly drill down into your data.
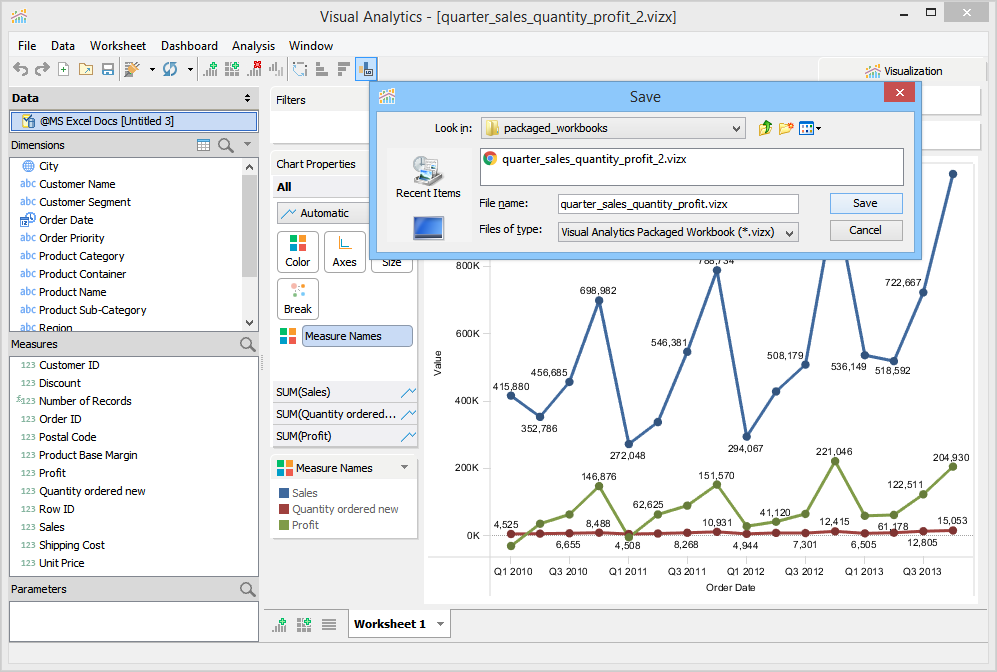
Packaged Workbooks
Save your workbooks and data extracts to disk for later use or to share with colleagues. Save your full design, metadata and data extracts, or only your design, metadata and server connection information.
References
- ^ Visual Analytics Wikipedia article. Visual analytics is an outgrowth of the fields of information visualization and scientific visualization that focuses on analytical reasoning facilitated by interactive visual interfaces.
- ^ R (programming language) R is a programming language and software environment for statistical computing and graphics.