AQUA DATA STUDIO
Versatile Visual Analytics Tool
- Explore your data to identify patterns and trends
- Create engaging visualizations, dashboards, and reports
Analyze data from
numerous data sources
- Connect to relational, cloud, and NoSQL databases
- Connect to analytics warehouses including Amazon Redshift and Google BigQuery
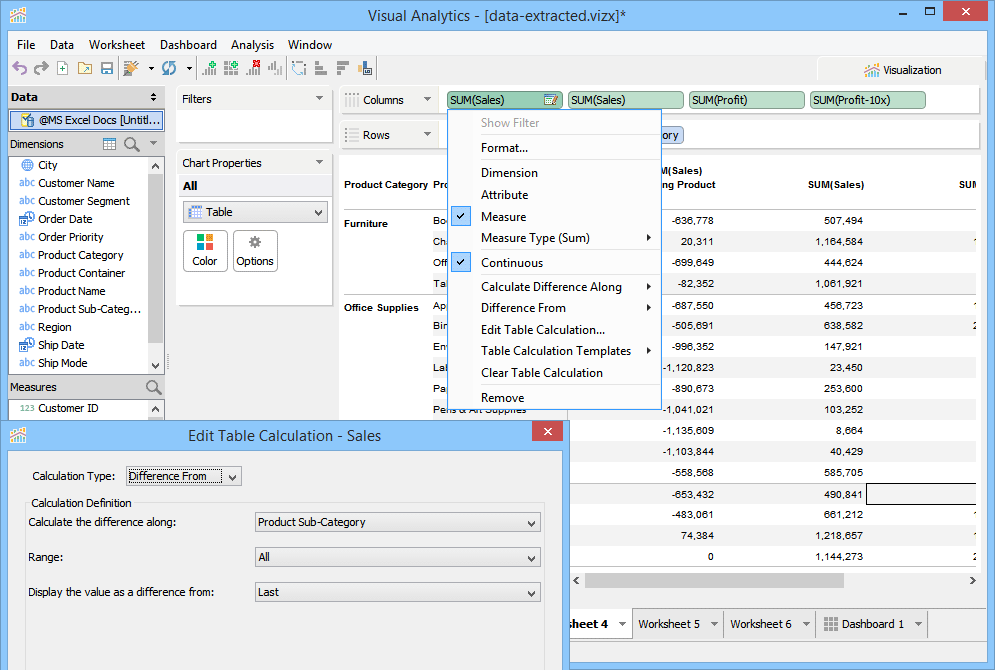
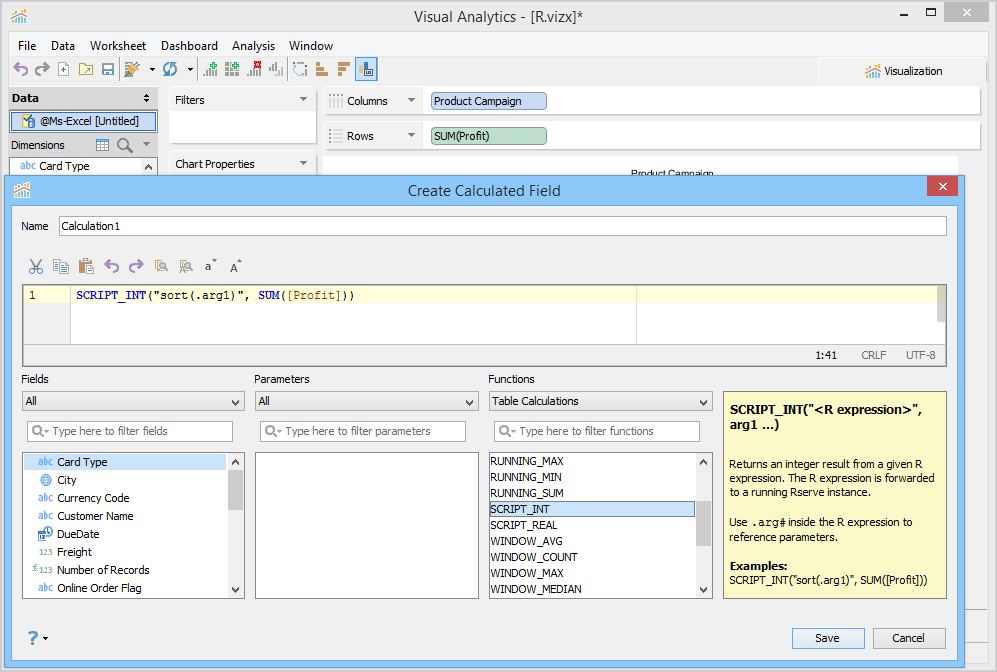
- Aggregate datasets, and calculate fields and parameters within datasets
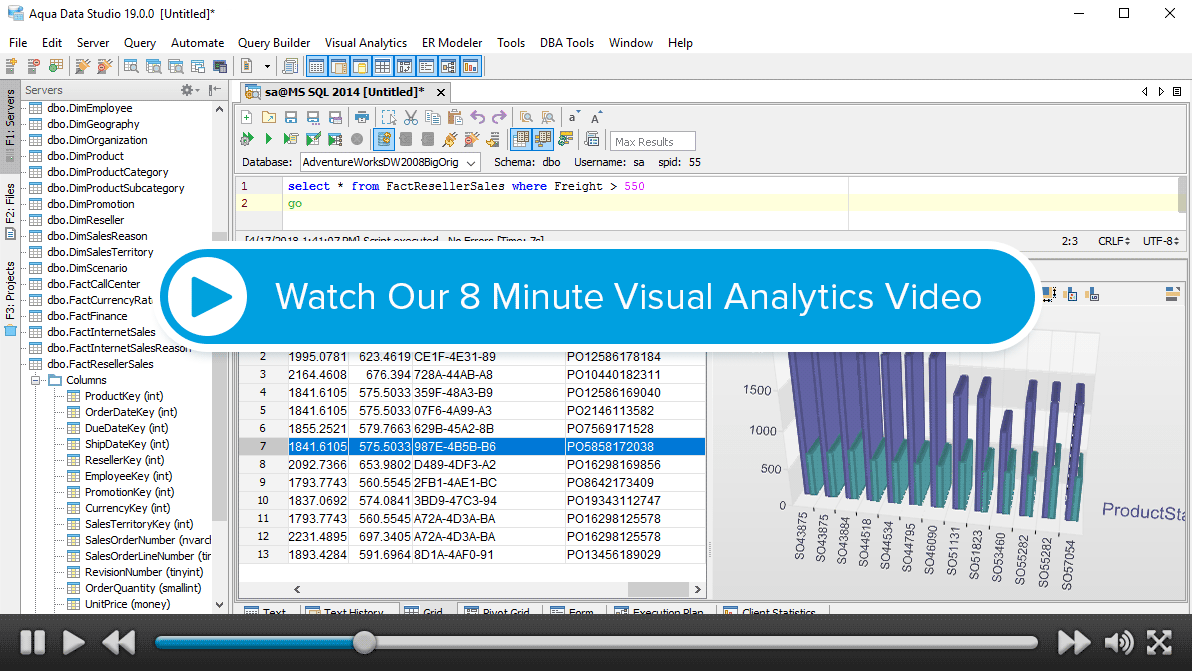
- Visually build SQL queries to interact with databases
Visualize data,
patterns, and trends
- Display configurable charts (such as scatter, Pareto, radar, pie, combination, and many more) and drill down into underlying data
- Produce information-dense visualizations and spreadsheet-style charts
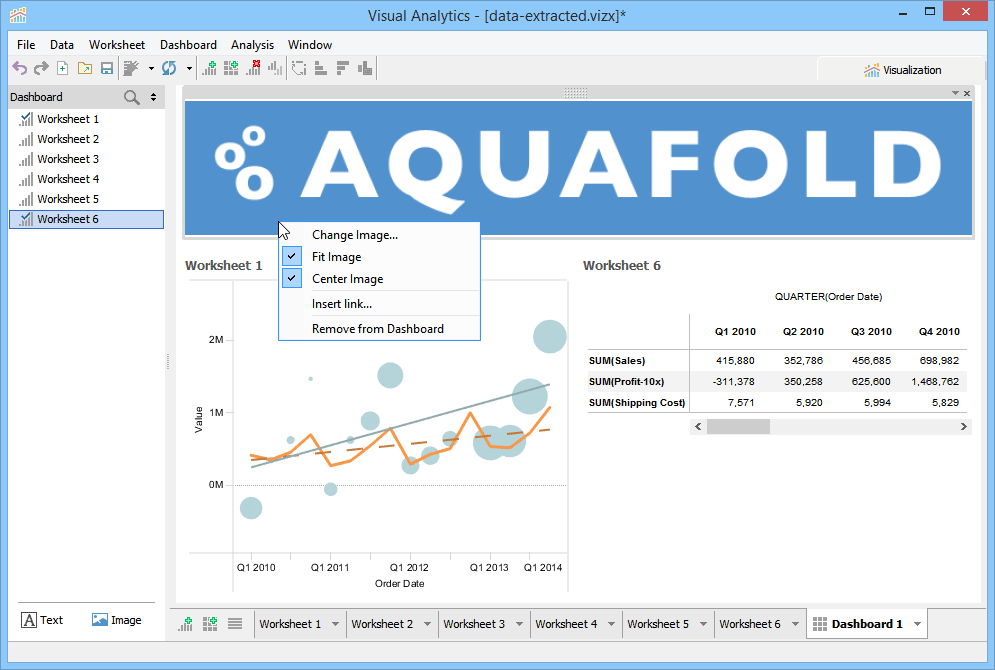
- Easily build data visualization dashboards and share them with others
- Update business intelligence (BI) reports quickly when changing filters while exploring data
Integrate with third-party tools
- Write extract-transform-load (ETL) scripts with the application programming interface (API)
- Build web applications that connect to numerous data sources including forms and files with the API
- For data analytics, access statistical data analysis that runs in R
- Connect to third-party version control systems to manage SQL scripts, database files, etc
Manage databases and data end-to-end from creating databases to
analyzing and reporting on data in a single application. Learn more.
“Aqua Data Studio is full-featured, it is fast to install, it is quick to get up
to speed, and it has great visualization and comparison tools.”
Doug Campbell, IT Director, MP2 Energy (Small Business, Energy and Utilities Company, USA)TVID 975-6B6-8CC